In the above mentioned unit, we need to run the ‘plant detector’ script with and without a plant in robot’s sight, record the execution of callbacks (listener callback and detected plant callback), and observe the callback timeline using a tracer.
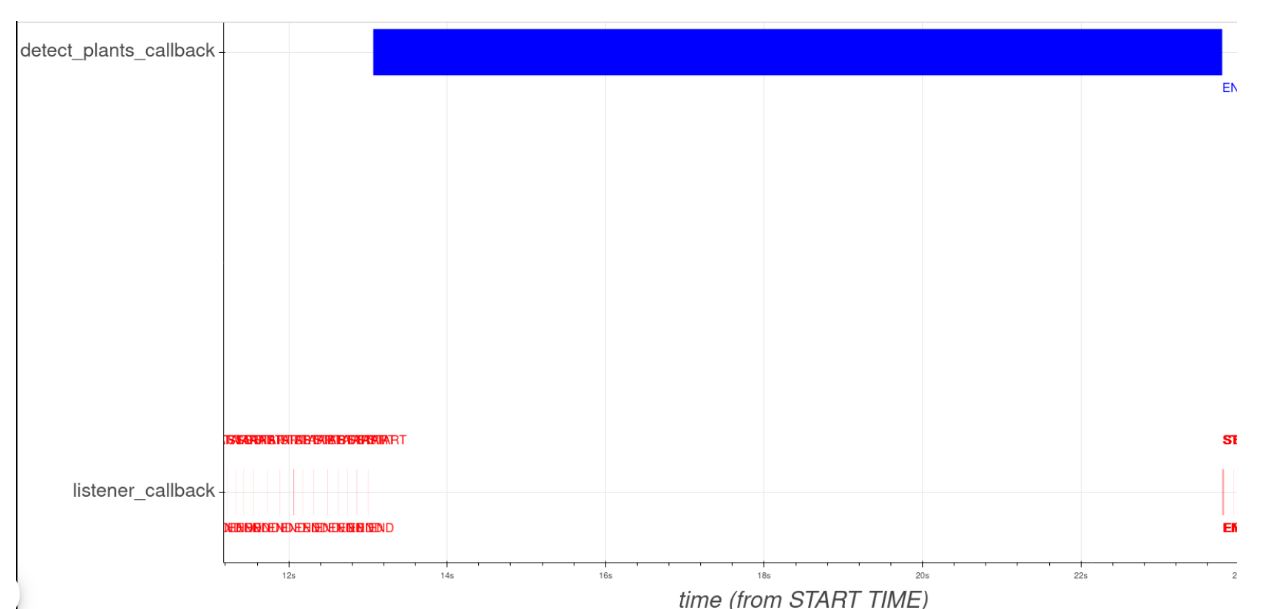
The result of the tracer should look something like:
I have tried this a couple of times now. (The x-axis of the graph is not visible in the images as I couldn’t get it while screen grabbing but the scale is as expected.) So as per my tracer, the detected call back execution is taking place for less than a second.
But in the terminal, while running the program, the result for the runs is same for my run when compared to the lesson’s notes.
Why is there a difference between my tracer timeline and what actually happens while running the program?
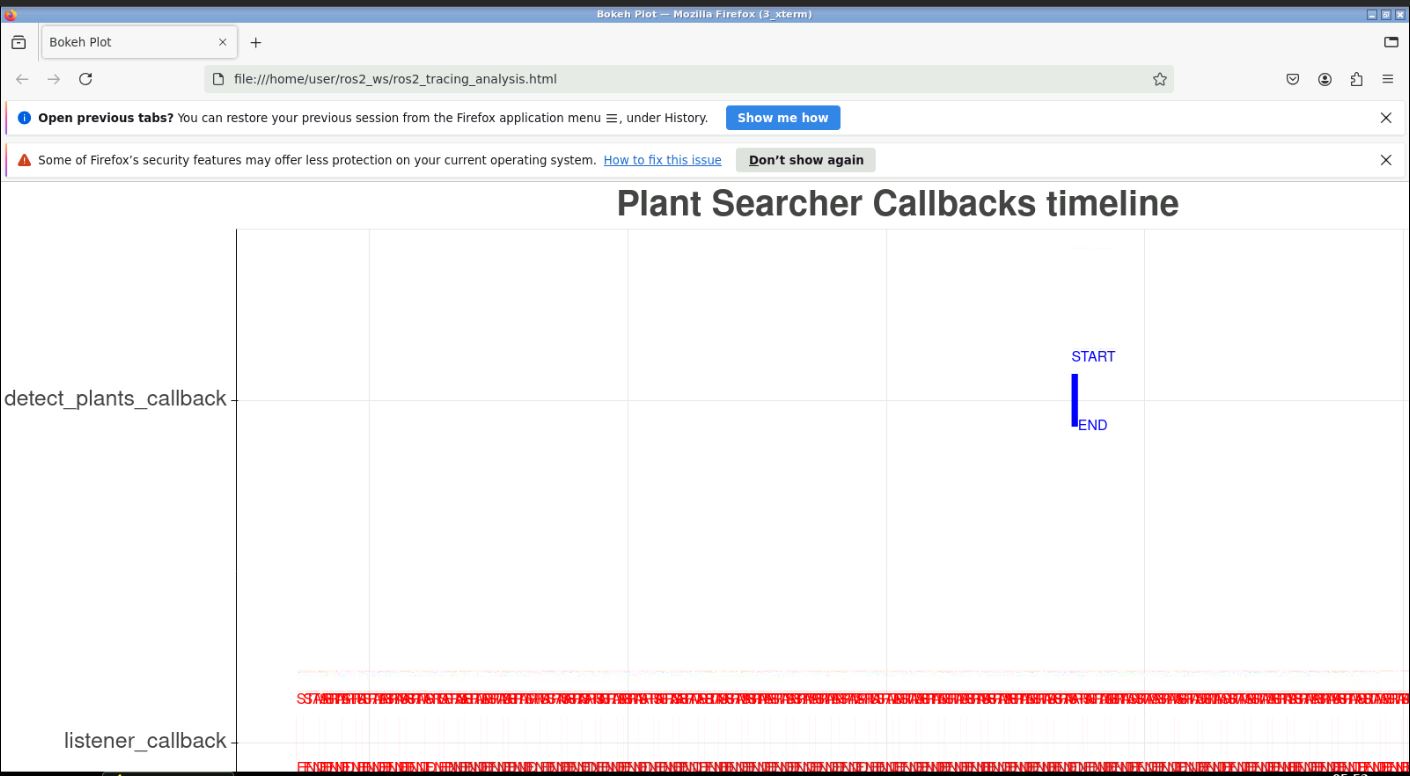
Hie @ninadmehta34 , the html file that is being rendered in not the correct one in the screen shot you have attached. May you please send the full screenshot of the graphical window so that we can check if you have other windows in the Graphical tools section. The unit is designed by default to label the files in exactly the way the example code is given so if you have not changed anything there as far as naming in concerned you should have this issue. With that said, I think the you may have other windows from the previous units that are not closing properly so that is where the error might be coming from.
Hello @takavarasha
I figured out the issue. It was with respect to the following command:
ros2 run ros2_callback_visualiser analise_trace_plant_searcher_callbacks.py
Using GDK_SYNCHRONIZE=1 sorted it out.
Thank you for your help!